
WSA Predictions Now Available in helioviewer.org
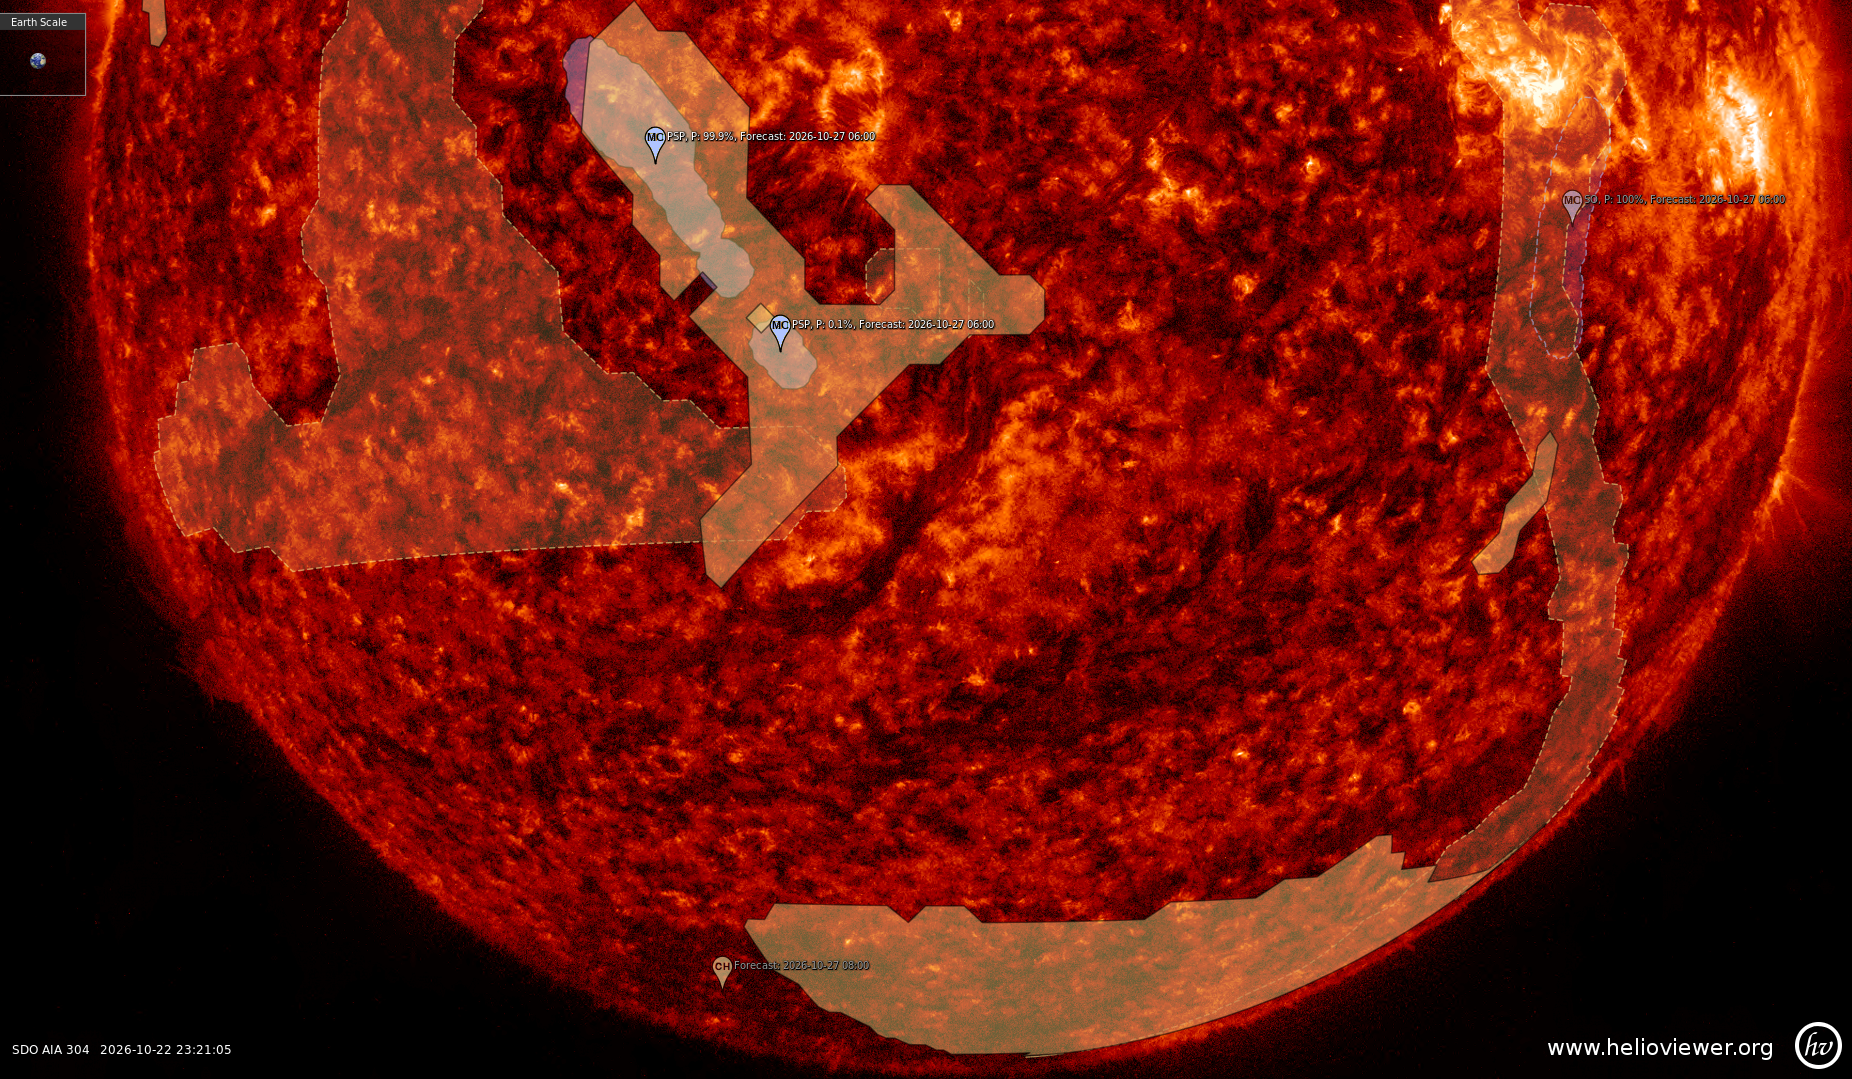
Coronal-hole maps and magnetic-connectivity footpoints from the WSA model are now available on helioviewer.org. WSA, the Wang-Sheeley-Arge model, is a model of the solar corona and the solar wind. It starts from maps of the magnetic field on the surface of the Sun and works out how that field opens into space. The Community Coordinated Modeling Center (CCMC) runs WSA and publishes its results on the WSA dashboard. Helioviewer now brings two of these results onto the solar images.
Coronal holes. These are regions where the Sun’s magnetic field is open to space instead of looping back to the surface. They look dark in extreme ultraviolet and X-ray images, and fast solar wind streams out of them. WSA predicts where the coronal holes are. Each prediction is one event in Helioviewer, and it holds all the hole outlines of that forecast.
Magnetic connectivity footpoints. The solar wind carries the Sun’s magnetic field out to the planets and spacecraft. The footpoint is the place on the Sun where the field line reaching a given spacecraft starts, so it shows where the solar wind arriving there most likely came from. WSA gives this as probability contours: the inner contours are the most likely origin.
Where to find it
Open Data Sources > Features and Events > WSA. There are two branches:
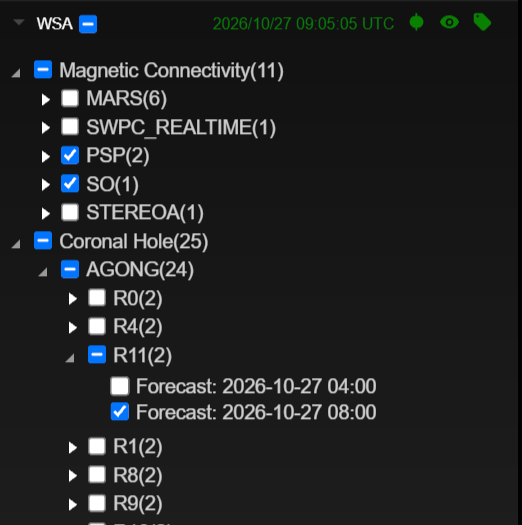
Coronal Hole: AGONG, with one entry per realization (R0 to R11), and GONGZ. These are the input magnetic maps WSA was run with. AGONG is an ensemble of 12 realizations, so you can look at one realization at a time.
Magnetic Connectivity: one entry per target, ACE, SWPC_REALTIME, PSP (Parker Solar Probe), SO (Solar Orbiter), STEREOA and MARS.
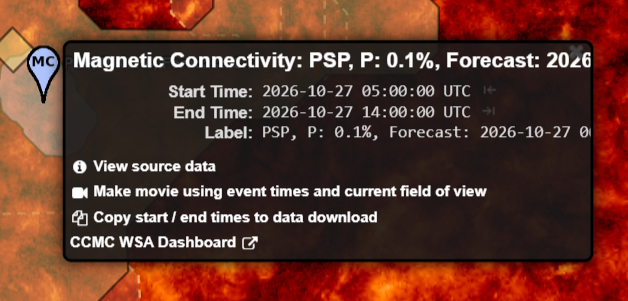
Click any WSA marker to see the forecast time, the forecast window and, for footpoints, the connectivity probability, with links back to the WSA dashboard.
Movies and screenshots
WSA events work like every other event in Helioviewer: you can put them into screenshots and movies. Here is a movie made on helioviewer.org:
New event capabilities on helioviewer.org
WSA coronal holes, magnetic connectivity footpoints and their probability regions can sometimes be behind the Sun as seen from Earth. To handle this, helioviewer.org now shows events and regions on the far side in a different style, so you can always tell what is in front of the Sun and what is behind it.
Events behind the Sun
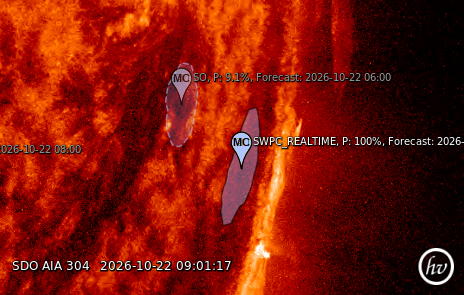
As the Sun rotates, an event can move behind the limb. It does not disappear: its marker and label are drawn faded, and you can still click it to see its details.
The image shows two WSA magnetic connectivity footpoints. One is on the near side of the Sun and is drawn as usual. The other is behind the Sun, so its marker and label are faded.
Near-side and far-side regions
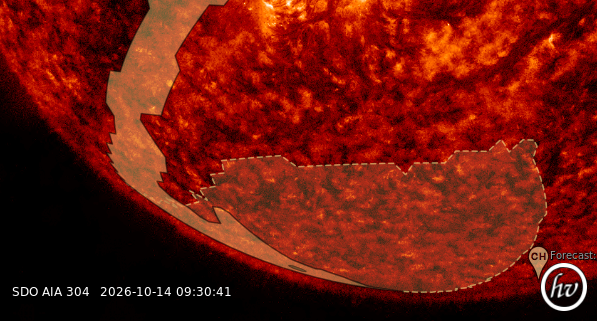
Regions are drawn by which side of the Sun they are on:
- Near side: filled, as before.
- Far side: a dashed outline with a light tint.
- Crossing the limb: cut at the limb into the two.
The image shows a WSA polar coronal hole stretching over the south pole. The part on the near side, along the east limb, is filled. The part that reaches over the pole onto the far side is drawn with a dashed outline. It still projects onto the disk, but the dashed outline shows it is behind the Sun.
Links
- CCMC WSA dashboard: https://ccmc.gsfc.nasa.gov/wsa-dashboard/
- WSA dashboard on CCMC Community Tools: https://ccmc.gsfc.nasa.gov/community-tools/WSA-Dashboard/
- WSA model at CCMC: https://ccmc.gsfc.nasa.gov/models/WSA~5.4/
- WSA events in the Events API: https://events.helioviewer.org/api/v1/events/WSA/observation/2026-10-15T12:00:00Z
- Events API reference (OpenAPI): https://events.helioviewer.org/api-docs
Many thanks to the WSA team at CCMC for making these predictions available and for their help.
If you have questions or comments about WSA in Helioviewer, please send us an email or file an issue on the helioviewer.org project page.